Geographic Information System (GIS) is an information system designed to work with spatially referenced data or berkoordinat geography or in other words, a GIS is a database system with specific capabilities for spatially referenced data handling ( spatial) working in conjunction with a set of operations (Barus and Wiradisastra, 2000).
Meanwhile, according to Anon (2001) geographic information system is an information system that can combine the graphical data (spatial) and text data (attributes) that are connected in geogrfis object on earth (georeference). In addition, GIS can also combine data, organize the data and perform data analysis which ultimately will produce output that can be used as a reference in decision-making on issues related to geography.
Geographic Information Systems are divided into two groups: manual systems (analog), and automated systems (digital-based computers). The most fundamental difference lies in the way of management. Information systems are usually manually merge some data such as maps, transparencies for overlapping stacking (overlay), aerial photography, statistical reports and reports of field surveys. All of the data is compiled and analyzed manually with a tool without a computer. While automated Geographic Information Systems has been using the computer as a data processing system through the process of digitization. The data source can be either digital or satellite imagery and digital aerial photographs were digitized aerial photographs. Other data can be digitized base map (Nurshanti, 1995).
Understanding GIS / SIG today is more often applied to the spatial or geographic information technologies oriented to the use of computer technology. In conjunction with computer technology, Arronoff (1989) in Anon (2003) defines GIS as a computer-based system that has the ability to handle data that is referenced geographic data entry, data management (storage and recall), manipulating and analyzing data, as well as the output the final result (output). While Burrough, 1986 defines a Geographic Information System (GIS) as a computer-based system used to enter, store, manage, analyze and re-enable the data that have spatial reference for a variety of purposes related to mapping and planning. The main components of Geographic Information Systems can be divided into 4 main components: hardware (digitizer, scanner, Central Procesing Unit (CPU), hard disk, etc.), software (ArcView, Idrisi, ARC / INFO, ILWIS, MapInfo, etc.), organization (management) and user (user). The correct combination of the four main components will determine the success of a development project Geographic Information Systems.
GIS applications can be used for various purposes for which the data is processed has geographic references, meaning the data is composed of the phenomenon or object that can be presented in a physical form and spatial location (Indrawati, 2002).
The main objective of the use of Geographic Information Systems is to make it easier to get the information that has been processed and stored as an attribute of a location or object. The main characteristic of data that can be used in Geographic Information Systems is the data that has been tied to the location and a basic data that has not been specified (Dulbahri, 1993).
The data are processed in GIS is basically composed of spatial data and attribute data in digital form, so that the analysis can be used is the analysis of spatial and attribute analysis. Spatial data is data relating to the spatial location of the general shape of the map. While attribute data is a data table that serves to explain the existence of various objects as spatial data.
The presentation of spatial data has three basic ways, namely in the form of dots, lines and shapes form area (polygon). The point is a single appearance of a pair of x, y coordinates showing the location of an object such as height, location of the city, the location of the sample and the others. The line is a set of points which form an elongated appearance such as rivers, roads, and other kontus. While the appearance of the area is bounded by a line that forms a homogeneous space, for example: boundary, limit the use of land, islands, and so forth.
Spatial data structure divided into two raster data models and data models vector. Raster data is data that is stored in a rectangular box (grid) / cell, forming an orderly space. Vector data is data that is recorded in the form that displays the coordinates of the point, placing and storing spatial data using point, line or area (polygon) (Barus and Wiradisastra, 2000).
Lukman (1993) states that the present geographic information systems spatial information and its attributes which consists of several main components:
1. Input data is the process of entering data on a computer from maps (topographic maps and thematic maps), statistics, data analysis of remote sensing data from remote sensing digital image processing, and others. Spatial data and attribute in the form of analog or digital data is converted into the format required by the software to form the database (the database). By Anon (2003) database is organizing data in a computer so it is not redundant to do the development, renewal, calling, and can be shared by users.
2. Data storage and recall (data storage and retrieval) is the storage and retrieval of data on a computer back quickly (look on the screen and can be displayed / printed on paper).
3. Data manipulation and analysis are activities that can be done a variety of commands such as map overlay between the two themes, create a buffer zone a certain distance of an area or a point and so on. Anon (2003) says that the manipulation and analysis of data is a major feature of the SIG. GIS capabilities in a joint analysis of spatial data and attribute data will yield useful information for a variety of applications
4. Data reporting is to present the basic data, the data processing of the data from the model into the form of maps or tabular data. According Barus and wiradisastra (2000) form a GIS product may vary both in terms of quality, accuracy and ease of the wearer. These results can be made in the form of maps, tables figures: text on paper or other media (hard copy), or in the print software (such as an electronic file).
By Anon (2003) there are several reasons why it is necessary to use GIS, such as:
1. GIS spatial data and attribute using an integrated
2. GIS can digunakansebagai interesting interactive tools in order to increase the understanding of the concept of location, space, demographic and geographic elements that exist on the surface of the earth.
3. GIS can separate the presentation and database
4. GIS has the ability to decipher the elements that exist on the surface of the earth into several layers or spatial data coverage
5. SIG has an excellent Traffic in visualizing spatial data following attributes
6. All operations can be performed in an interactive GIS
7. Results were obtained with a simple GIS thematic maps
8. all GIS operations can costumize by using the commands in the scripting language.
9. Peragkat GIS software provides the facility to communicate with other software
10. GIS greatly assist the work that is closely related to the field of spatial and geoinformatika.
Barus and Wiradisastra (2000) also revealed that GIS is a powerful tool for handling spatial data, which the GIS Data maintained in digital form so that the data is more compact than in the form of printed maps, tables or any other conventional form that will eventually speed up the work and alleviate the costs.
Primary means for handling spatial data is GIS. GIS is designed to accept large amounts of spatial data from various sources and mengintergrasikannya become an informed, one type of data is the remote sensing data. Remote sensing has the ability to produce spatial data geometric arrangement of the actual state approaching quickly and in large quantities. Barus and Wiradisastra (2000) said that the SIG will provide added value to the remote sensing capability to produce large spatial data where the utilization of remote sensing data depends on the handling and processing of data which will turn it into useful information.
Currently, GIS is berbgai diapliksikan in areas such as agriculture, environment, natural resource management sumbur, tourism, geology, planning and so forth. Why is used by SIG excellence in these areas is the ability to integrate the spatial data and attribute data so that the analysis of complex information capable of excellent results were obtained. In addition to these capabilities is a result of the time savings Apliksi SIG.
Apliakasi GIS in the planning process very diverse forms depending on user needs. Anon (2003) says that the point of application of GIS is suspected of various activities undertaken such as monitoring pollution, changes in land use or a development plan. Taken as an example is a plan to build irrigation systems and dams. If a dam is built diloksi particular, it can be developed in several follow-up question is how to make variations of the structure or form and analyzed how the effect or other scenarios that could be developed such as those associated with the age of the dam itself.
In general, to get answers from the information available, we need a framework of good questions. Barus and Wiradisastra (2000) provide an illustration of the system framework menganai need answers about possible dangers and management sector in urban areas.
1. The presentation of all the data available to target specific answers such as databases on public roads or existing facilities
2. data pattern should be visible, such as the value of a particular region in land prices
3. predictions about the data or the results associated with a different time and place. For example estimate occurrence of natural disasters, it is important to know to make possible emergency scenarios.
To get the answers to the above, it is necessary to recognize the characteristics of the data needed regarding specific questions, namely:
1. data types that are available, how its shape? For example, in data Cadastral hence the name and address of the owner of the house or the land need to know
2. how the pattern of the data? This question is asking for information related to the pattern of the spread of certain valuable as houses. So if all the data are presented all at once, the necessary information such as homes that have sold more expensive than the value of USD 100 million will be immediately visible
3. data can be modified into any kind? This question is important to develop the desired model. The model can be made as simple as suspect crop production this year with an analysis based on data from last year and this year. But this model can also be more complicated example to predict changes in river flow downstream in the event of changes in the forest in the upper watershed.
Of the question that the necessary functions are functions of the storage and retrieval, the selection function is limited and modeling functions. These three functions will be modeled to explore the way to have the main areas, settlements worth more than $ 100 million and, determining the optimal path for the relief channel.
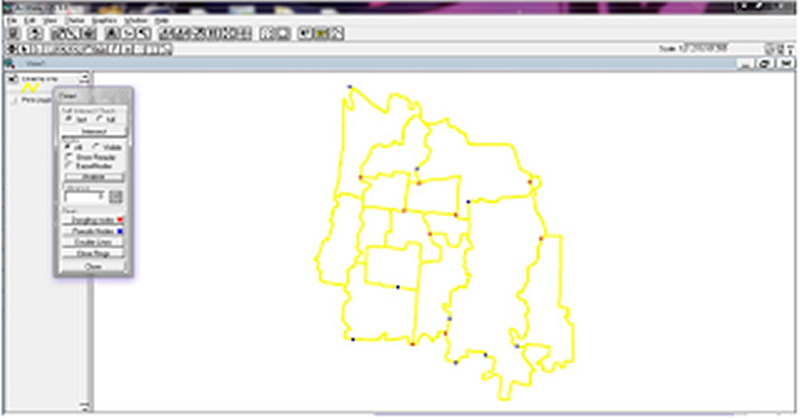
 Digitization can be generally defined as the process of converting analog data into digital format. Objects such as roads, houses, fields and others earlier in raster format at a high resolution satellite imagery can be converted into digital format by the digitization process.